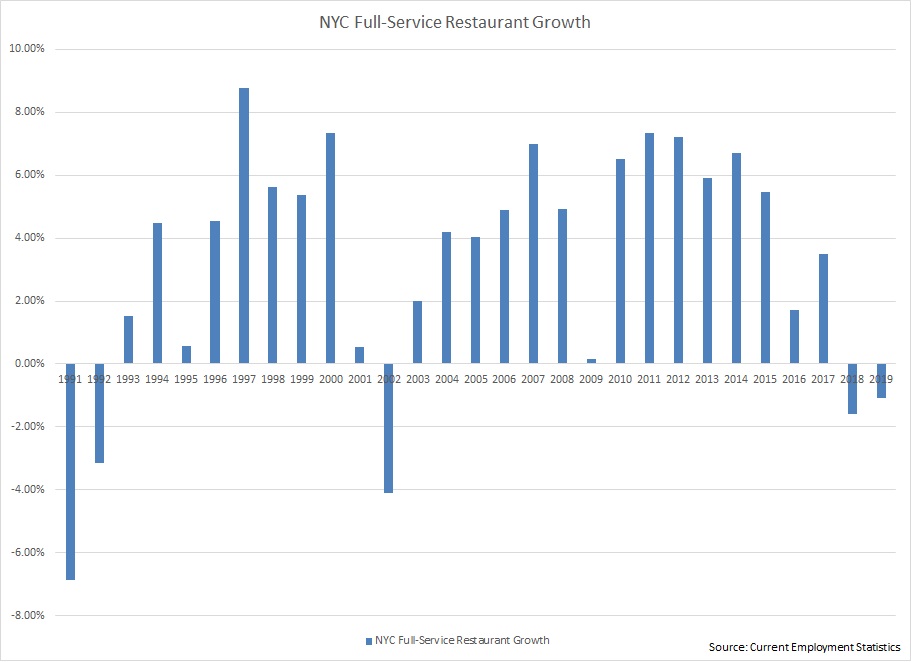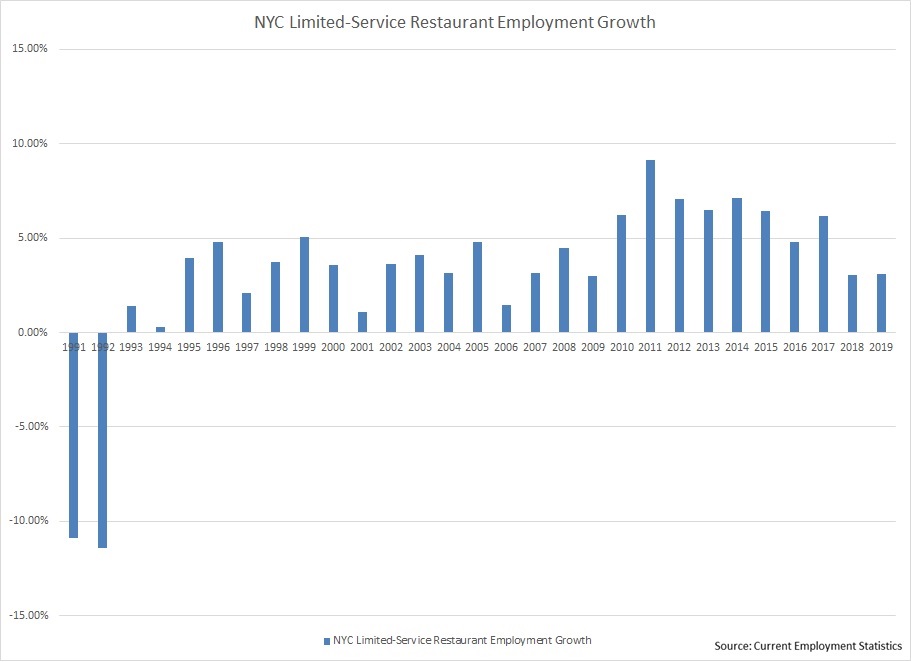
UPDATE (2/19/20): Newly-available Current Employment Statistics data, covering through the end of 2019, show that New York City suffered its second year of falling full-service restaurant employment. This is the first time in thirty years the city’s full-service industry has faced back-to-back years of job losses. Updated charts for limited- and full-service are included at the end.
The anecdotal and empirical evidence on the harm caused by New York’s minimum wage experiment is overwhelming. Consider the following:
- Multiple news articles — including extensive reporting by the Wall Street Journal and Crain’s New York Business —have covered the business closures and cutbacks that followed in the wake of severe wage hikes.
- Survey data covering hundreds of restaurants in the city identified a substantial subset of business owners who have cut staff or work hours to adapt to the rising costs.
- Meanwhile, labor market data published by the state shows that full-service restaurant growth in the city flat-lined and then turned negative after a series of steep hikes in the minimum and tipped minimum wage (which began at the end of 2015).
Despite mountains of evidence the contrary, labor unions and their allies in academia insist that restaurant growth in New York City has never been better.
The latest example of this head-in-the-sand approach comes from James Parrott at the Center for New York City Affairs at the New School, who once ran the state’s labor-aligned think tank and who’s seemingly never met a minimum wage increase he didn’t approve of. (Before the state’s recent wage increases had even begun, Parrott proclaimed that “the net overall impact would be positive.”) His new report, co-authored with graduate student Lina Moe and SEIU sidekicks at the National Employment Law Project, describes the city’s restaurant growth as “remarkable,” and suggests that reports of consequences are contradicted by a “review of comprehensive government data.”
The authors use this analysis to argue for the elimination of the tip credit–a one-time policy priority that has apparently been abandoned following robust employee opposition.
In truth, Parrott and his co-authors cherry-pick government data to fit their thesis; where the numbers don’t fit, they either ignore the inconvenient data or provide excuses why it doesn’t line up. In perhaps the most-egregious sleight of hand, the authors pick a benchmark reference point for restaurant growth several years before the state’s radical minimum wage experiment began–taking credit for restaurant growth that evaporated after the minimum wage began rising.
- Inappropriate reference year: Parrott’s report starts measuring restaurant job growth beginning in 2013, identifying this as the year that increases in the state minimum wage began phasing in. In fact, the minimum wage for tipped employees remained flat over this time period, and the overall minimum wage rose modestly between late 2013 and late 2015. It was not until the end of 2015 that the tipped wage jumped by 50 percent overnight.
-
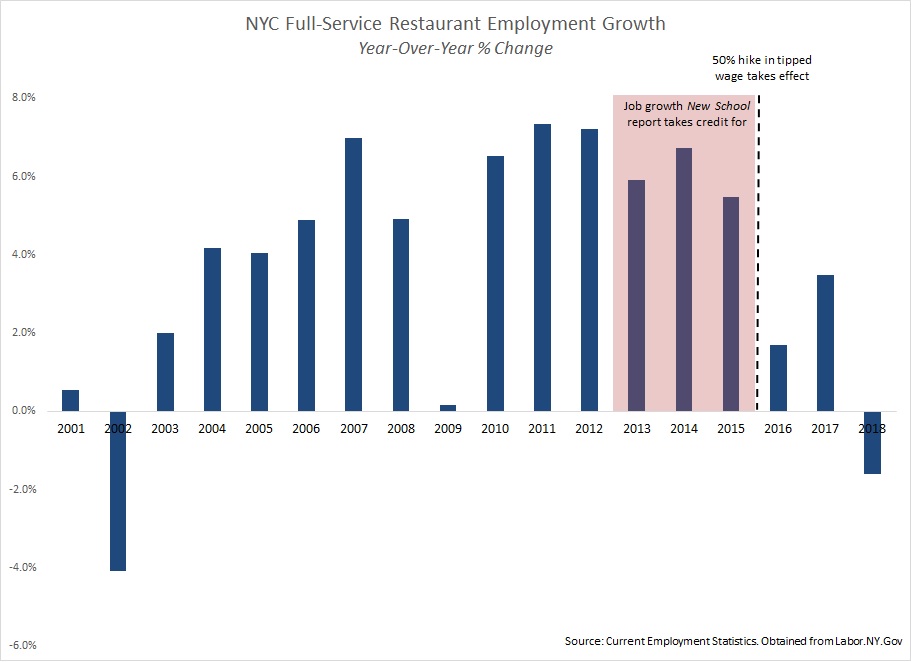
- The impact was felt immediately, both in stories of tipped wage-related business closures and in Current Employment Statistics (CES) data maintained by state Department of Labor. (See chart below.) The difference is stark: Job growth in the full-service restaurant industry averaged six percent annually between 2013-2015; between 2016-2018, it averaged just 1.2%. (These averages are similar in the QCEW.) Put differently: The full-service employment growth that Parrott takes credit for mostly occurred prior to unprecedented increases in the minimum wage.
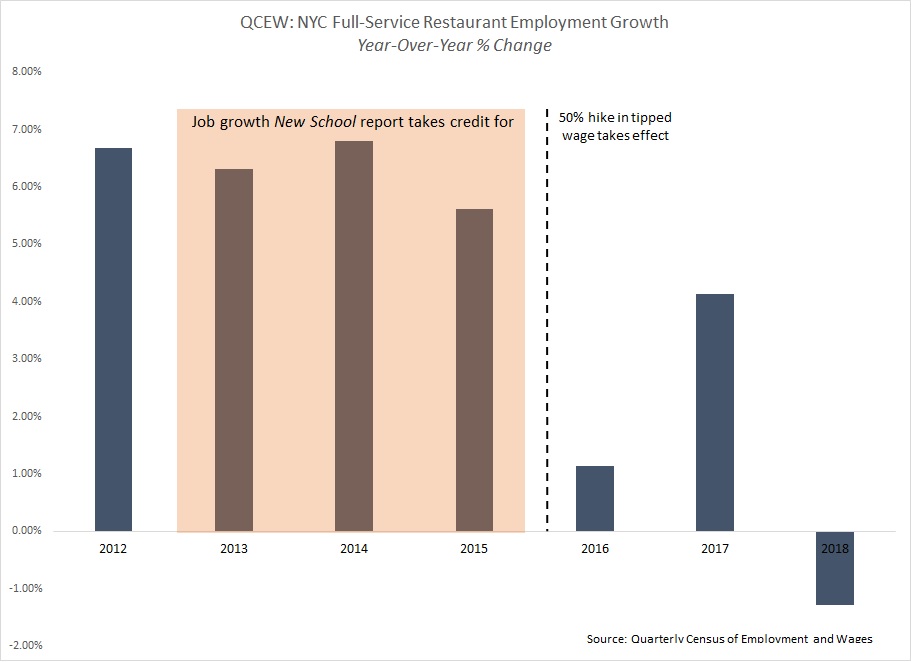
- Cherry-picking data points: The authors rely on the Quarterly Census of Employment and Wages (QCEW) for their analysis–ignoring or dismissing CES data maintained by the state, survey research data from the NYC Hospitality Alliance, and copious anecdotal data. Even their preferred data demonstrates a clear negative trend; a sharp full-service employment slowdown in NYC in 2016, and employment growth turning negative in 2018, both point to consequences of a sharp increase in labor costs. (See chart below.)
-
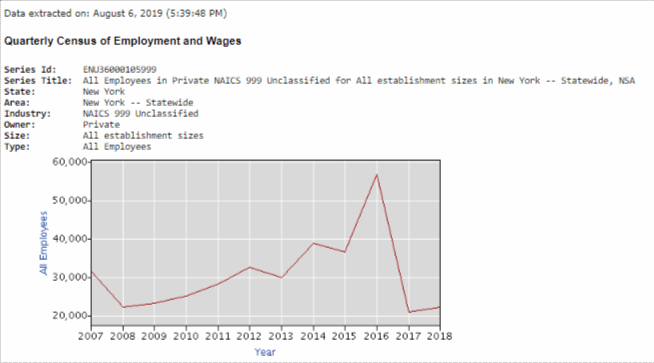
- The one unusual point is a seeming spike in restaurant establishments in 2017, and not just in New York City. The QCEW dataset showed a statewide jump of nearly 5,000 food service businesses—a change with no recent precedent in the state. (During New York’s boom years prior to the Great Recession, for instance, the state only added about 1,200 such businesses annually.) When this data was first released, the Census Bureau office responsible for this data set (in conversation with EPI) said the unprecedented change was most likely caused by a “non-economic reason”—specifically, the state’s reclassification of once-unclassified businesses as restaurants.
- Put differently, that would mean New York didn’t actually add more restaurants in 2017 than at any time in the recent past; rather, the state Labor Department added thousands of businesses that already existed to the “food services and drinking places” industry category. (The data lends support to this conclusion, with a massive drop in the number of unclassified businesses between the last quarter of 2016 and the first quarter of 2017 corresponding with an increase in those classified under food services.) EPI filed a public records request with the state in late 2018 to obtain data that sheds further light on this mystery; the state responded that it would be “unreasonable” to perform such an analysis.
Taken in total, the available evidence remains clear that New York City has experienced a dramatic slow-down in full-service employment growth, corresponding closely with the dramatic increase in the minimum wage for tipped employees. Efforts to dismiss this conclusion represents wishful thinking by labor groups who had their minds made up about the policy long before it took effect. Try as they might, Parrott and the New School can’t get away with new math to create new realities for the city’s full-service restaurants.
Addendum: Full-service and Limited-service Restaurant Employment Growth, 1991-2019