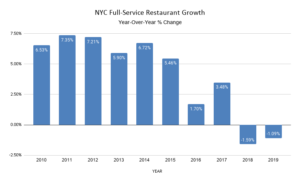
Recently-released data from the New York State Department of Labor show that New York City suffered its second straight year of declining employment in the full-service restaurant industry. Nearly 5,000 full-service restaurant jobs have been lost in the city since 2017. The city hasn’t experienced consecutive years of declining full-service restaurant employment in three decades.
Between 2010-2015, employment in the city’s full-service restaurant industry grew by 6-7 percent annually; since that time, growth has averaged less than one percent, and been negative in two of the past four years. What changed? While the city’s full-service restaurants face multiple challenges, the most significant policy change is the 100 percent increase in the tipped minimum wage over a four-year period.
EPI has written extensively on the consequences of this tipped wage hike, which are documented by empirical and anecdotal evidence. The state was considering further increases in the tipped minimum wage but ultimately backed off that idea after an “overwhelming majority” of restaurant workers opposed the change.
These workers understand what the data clearly shows: A higher tipped minimum wage is devastating for the full-service restaurant industry, and the people who work in it.
| NYC Full-Service Restaurant Employment, 1991-2019 | ||
| Year | Employment | % Change |
| 2019 | 167.7 | -1.09% |
| 2018 | 169.6 | -1.59% |
| 2017 | 172.3 | 3.48% |
| 2016 | 166.5 | 1.70% |
| 2015 | 163.7 | 5.46% |
| 2014 | 155.2 | 6.72% |
| 2013 | 145.5 | 5.90% |
| 2012 | 137.4 | 7.21% |
| 2011 | 128.1 | 7.35% |
| 2010 | 119.3 | 6.53% |
| 2009 | 112.0 | 0.15% |
| 2008 | 111.9 | 4.92% |
| 2007 | 106.6 | 6.99% |
| 2006 | 99.6 | 4.90% |
| 2005 | 95.0 | 4.03% |
| 2004 | 91.3 | 4.18% |
| 2003 | 87.6 | 2.00% |
| 2002 | 85.9 | -4.09% |
| 2001 | 89.6 | 0.53% |
| 2000 | 89.1 | 7.35% |
| 1999 | 83.0 | 5.39% |
| 1998 | 78.8 | 5.63% |
| 1997 | 74.6 | 8.78% |
| 1996 | 68.6 | 4.54% |
| 1995 | 65.6 | 0.58% |
| 1994 | 65.2 | 4.47% |
| 1993 | 62.4 | 1.53% |
| 1992 | 61.5 | -3.14% |
| 1991 | 63.5 | -6.88% |
| Source: Current Employment Statistics | ||


